
Projects

Heart Disease Classification Machine Learning Model
Machine learning classification model that uses patient data to predict whether a patient has heart disease. Used logistic regression, k-nearest-neighbor, and random forest classification algorithms to predict if a patient has heart disease based on data such as age, sex, type of chest pain, resting blood pressure, cholestoral, fasting blood sugar, resting ecg results, and maximum heart rate.
.jpg)
Hockey Stats Data Scraper
Python code written to take data from hockey-reference.com that can be used for a machine learning model or a visualization dashboard.
University Library Book Recommendation System Database
Created a full relational database using MySQL Workbench that could be used by a university library. Designed and created a full relational database that would also allow users to review each book so that students and teachers could find the best books and textbooks for each subject.
Python RFM Analysis
Used python to determine how recently customers have shopped, how frequently they shop and how much they spend. I then classified customers based on those results.

Hockey Prediction Machine Learning Model
Used linear regression and random forest machine learning algorithms to predict the results of NHL hockey games based on data from previous games.
I am currently working on this project.

Asthma Patient Regression Model
Cleaned and transformed data for 99 asthma patients. Used clustering algorithms to try to create groups of patients. Created a random forest regression model to predict the severity of asthma symptoms for each patient based on the previous week’s data.

Book Tracker
Used Java and Spring Boot to create a web app to track books that I own, have read, and want to read. Used Cassandra for database management.
I am currently working on this project.
Interactive Data Visualization Dashboards
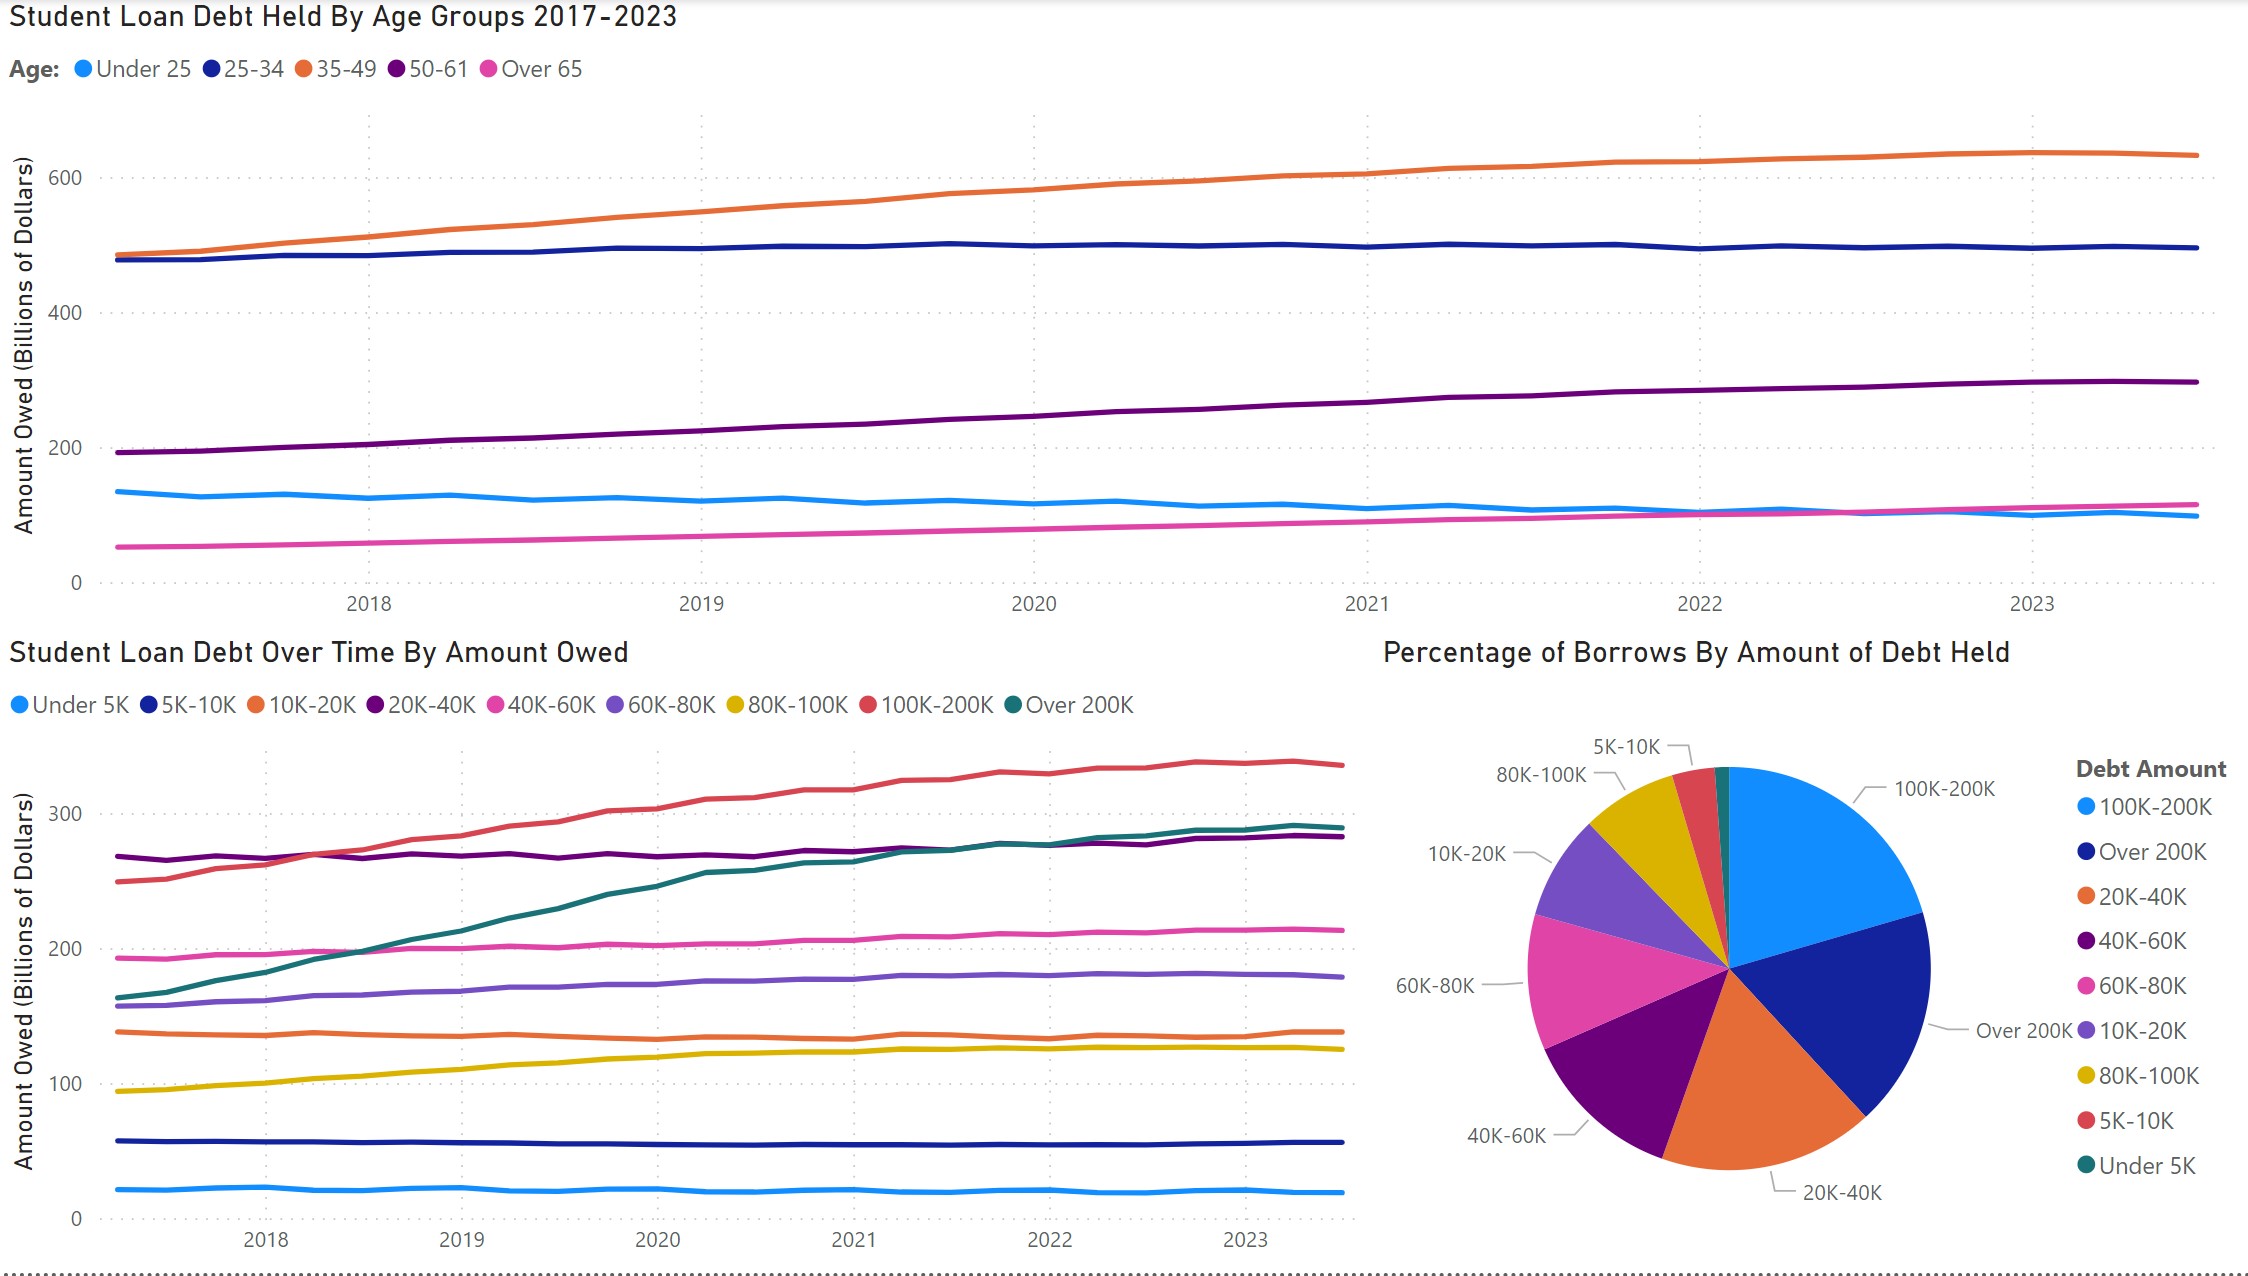
Student Loan Debt
Shows the amount of student loan debt in the US over time. One graph shows the amount held by different age groups over time, one shows the amount of debt held by groups with certain amounts of debt over time, one shows the amount of debt held in each state, and the last one shows how much debt is owed grouped by the amount of debt of borrowers.
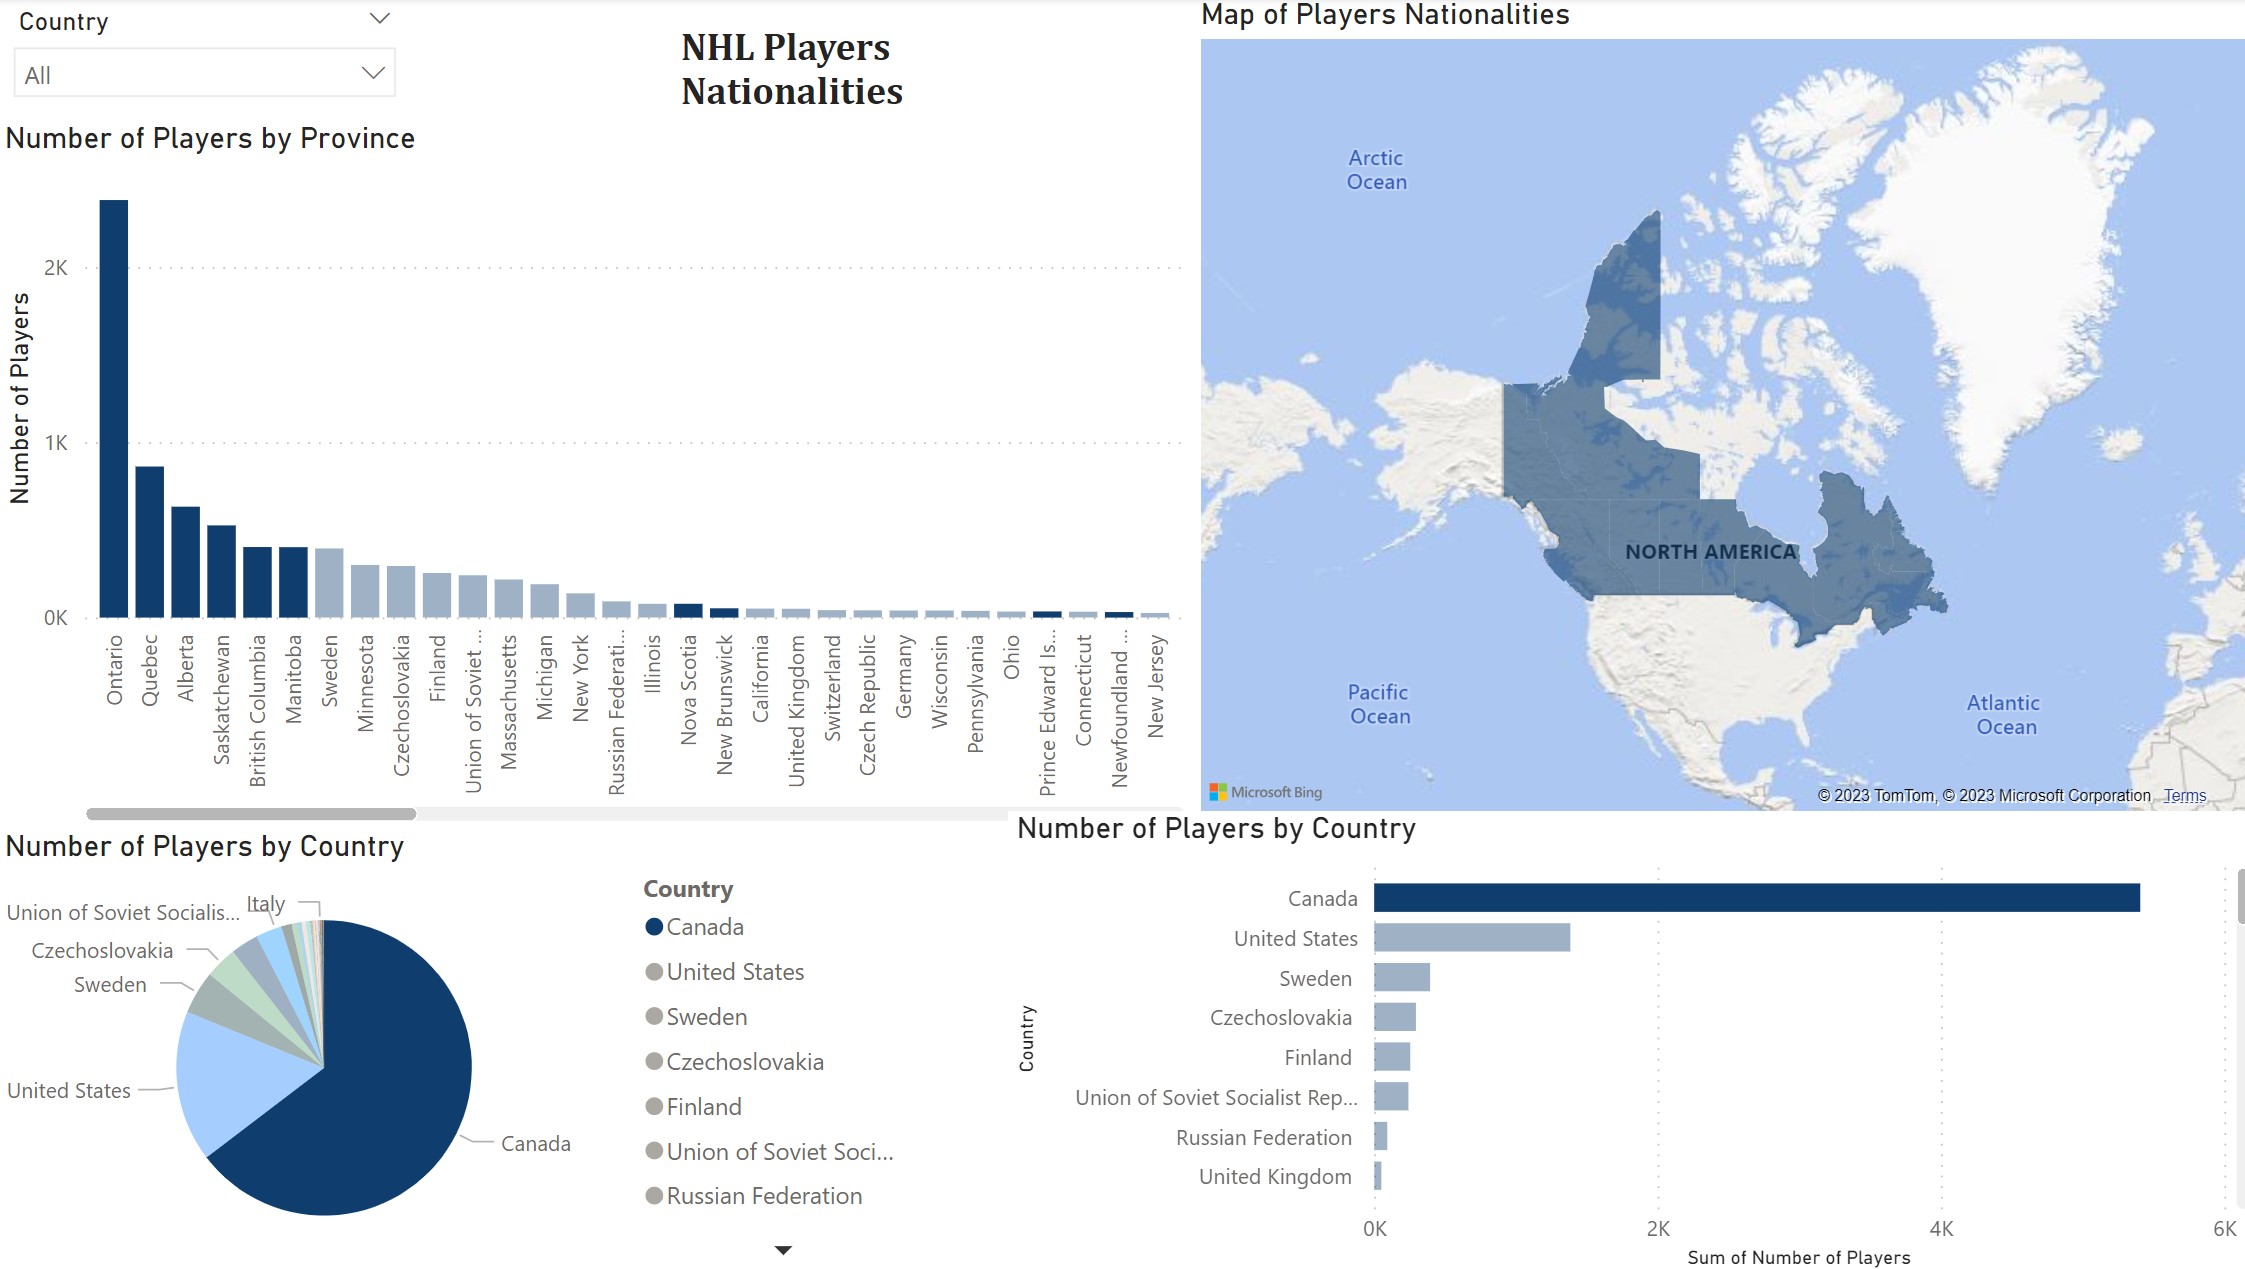
NHL Player Nationalities
Shows where NHL hockey players are from, broken down by provinces and states for Canada and the US. I could not find a good visualization of that data, so I took data from hockey-reference.com and built one myself.
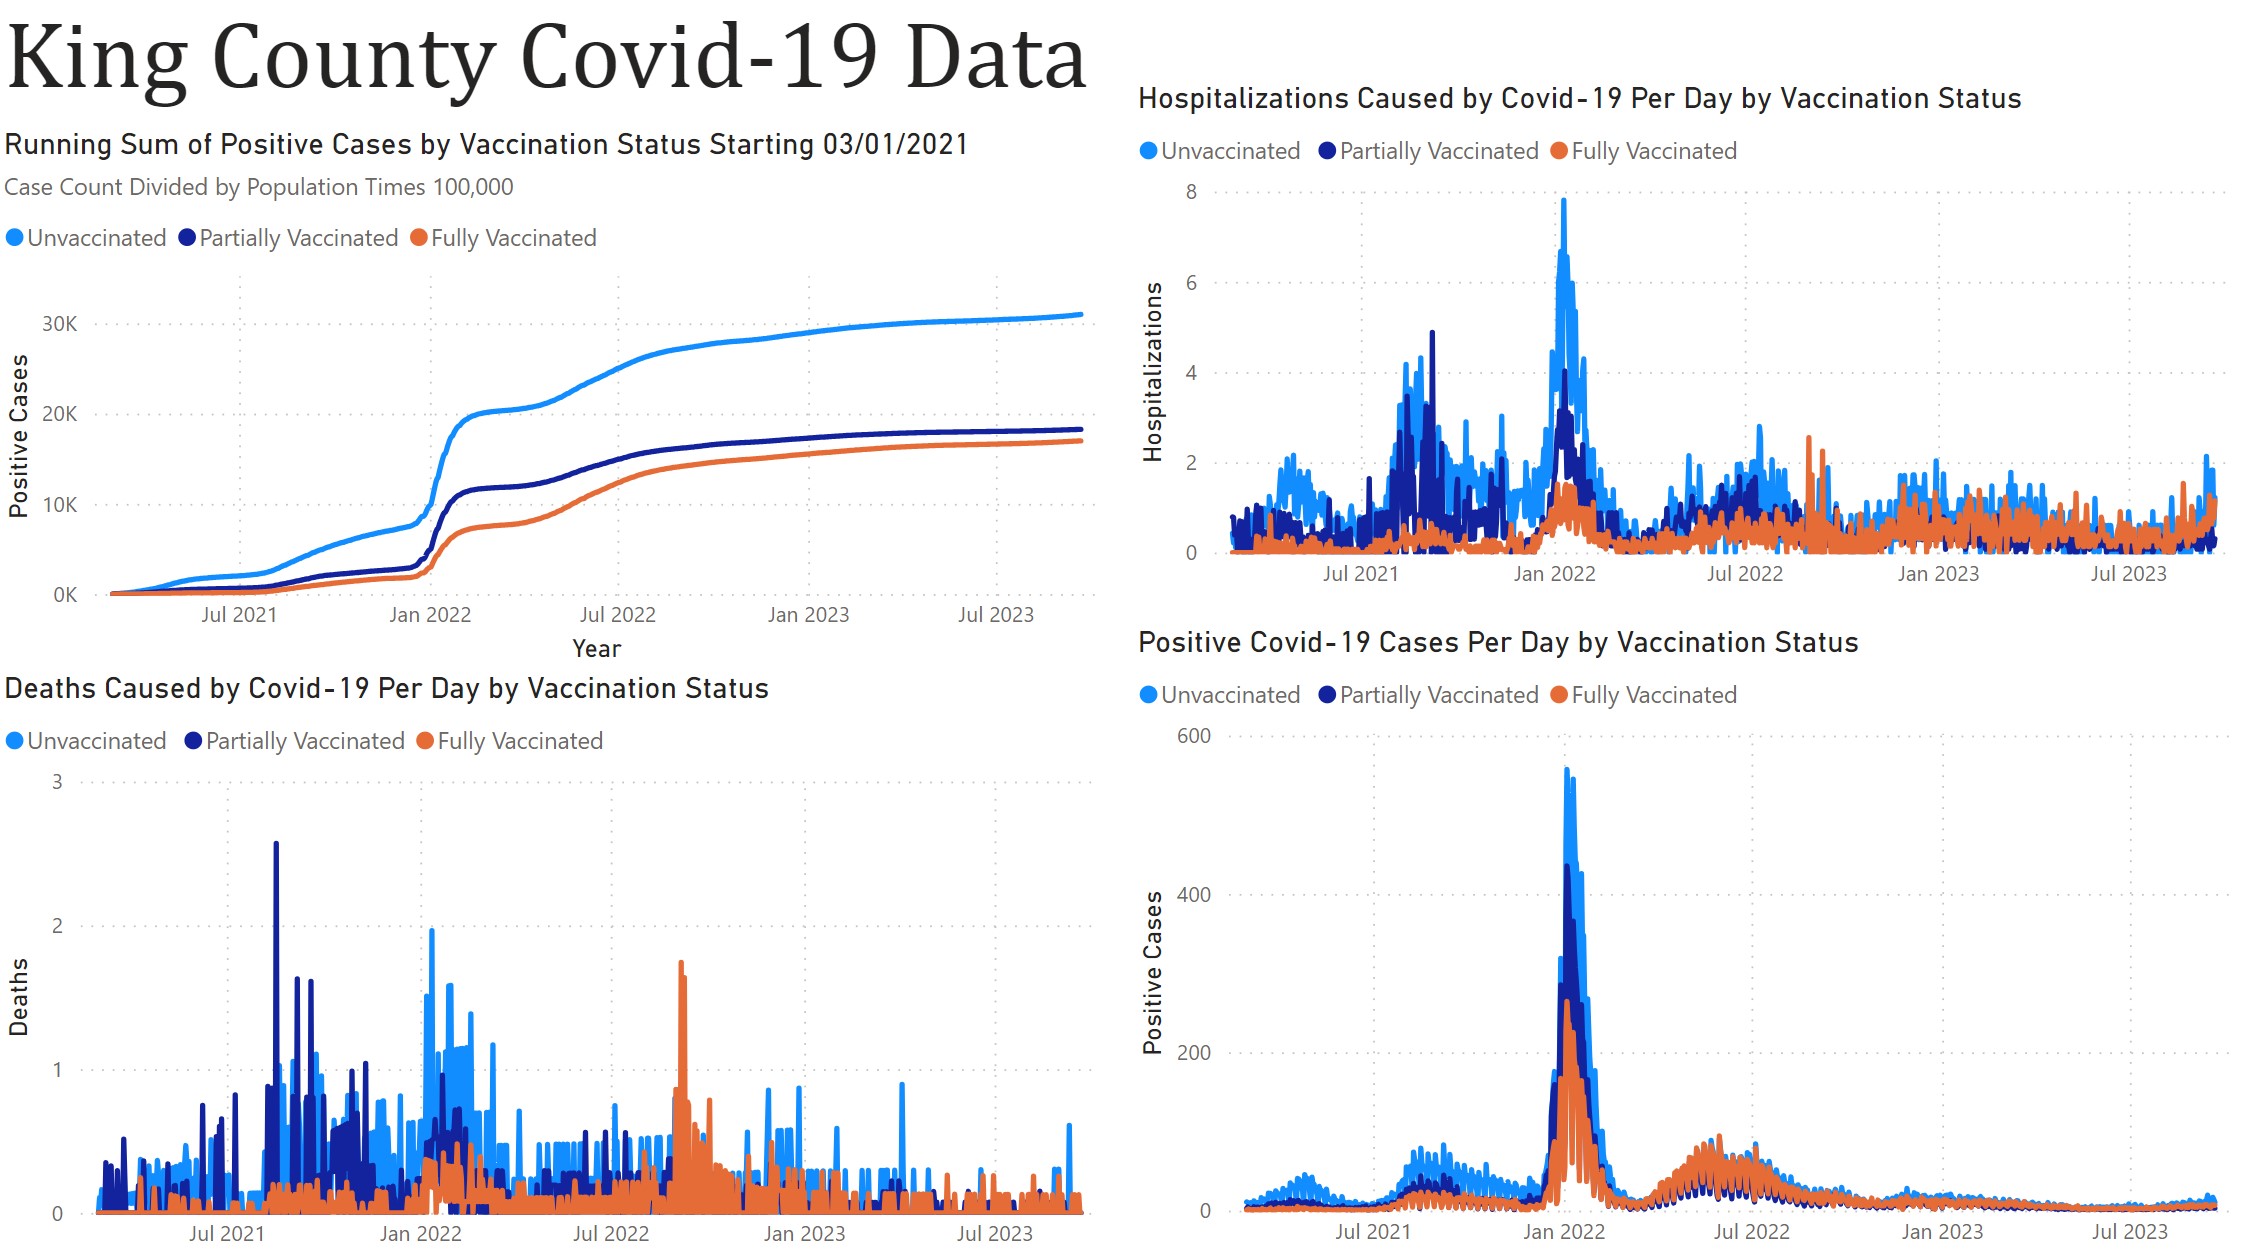
Covid-19 Cases, Hospitalizations, and Deaths
Shows the number of Covid-19 cases, hospitalizations, and deaths in King County, Washington by vaccination status over time. Also shows the sum of positive cases divided by the population of each group with a particular vaccination status over time.
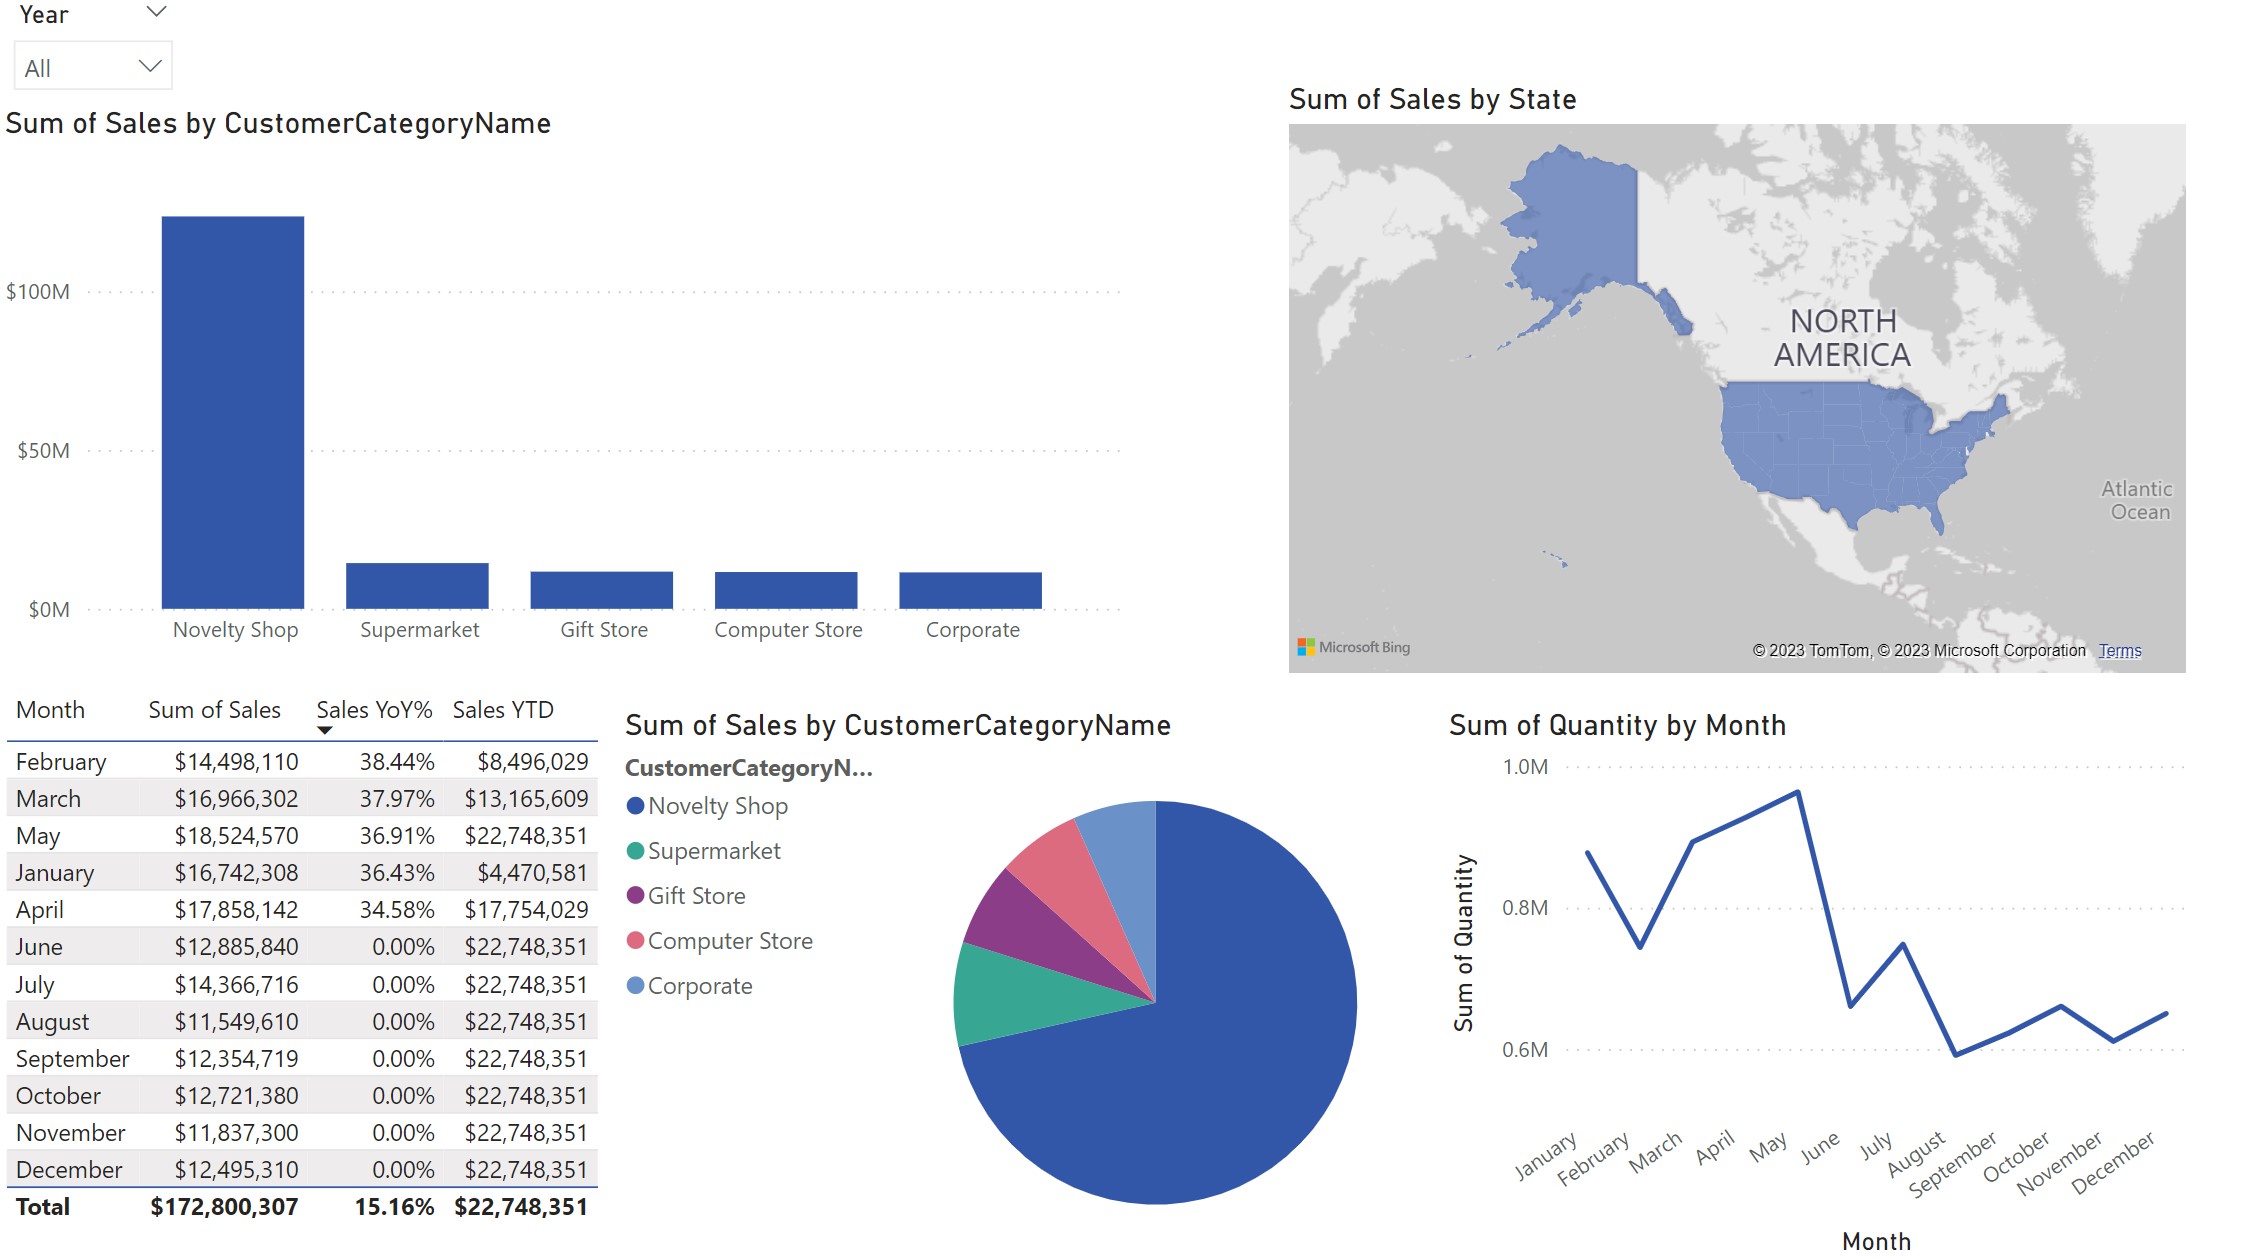
Sales Report
A simple interactive sales report created with data from kaggle, similar to ones I have made for work.
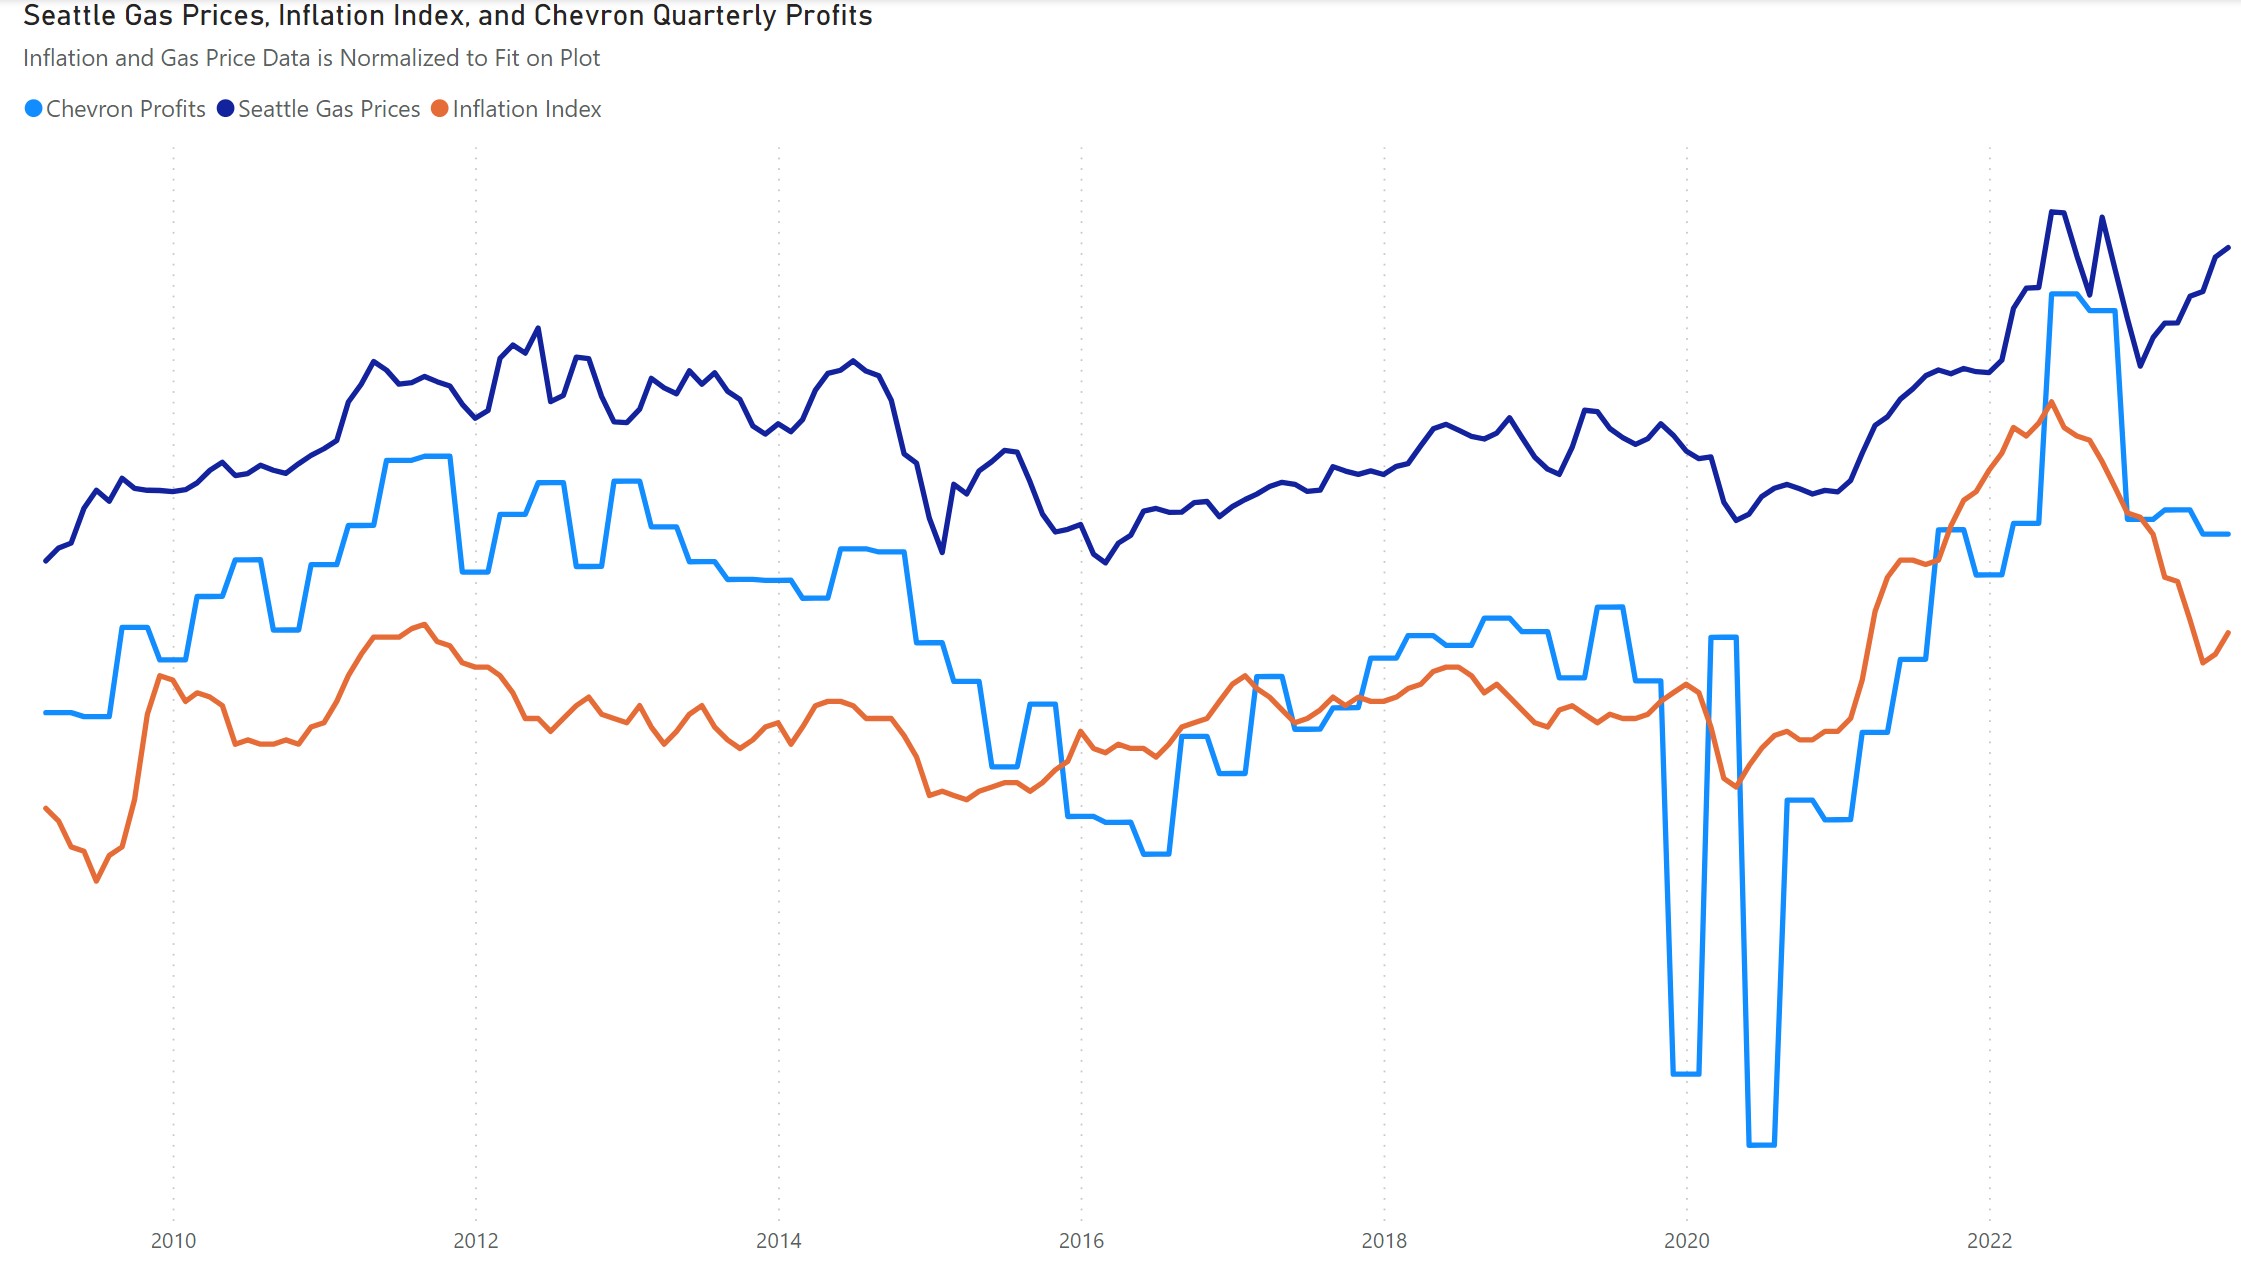
Gas Prices
Shows gas prices plotted vs. inflation and vs. the profits of prominent gas and oil companies.Examines gas prices in Seattle and shows how the rise and fall of prices correlated with the inflation index and with how much profit the gas and oil companies were making.
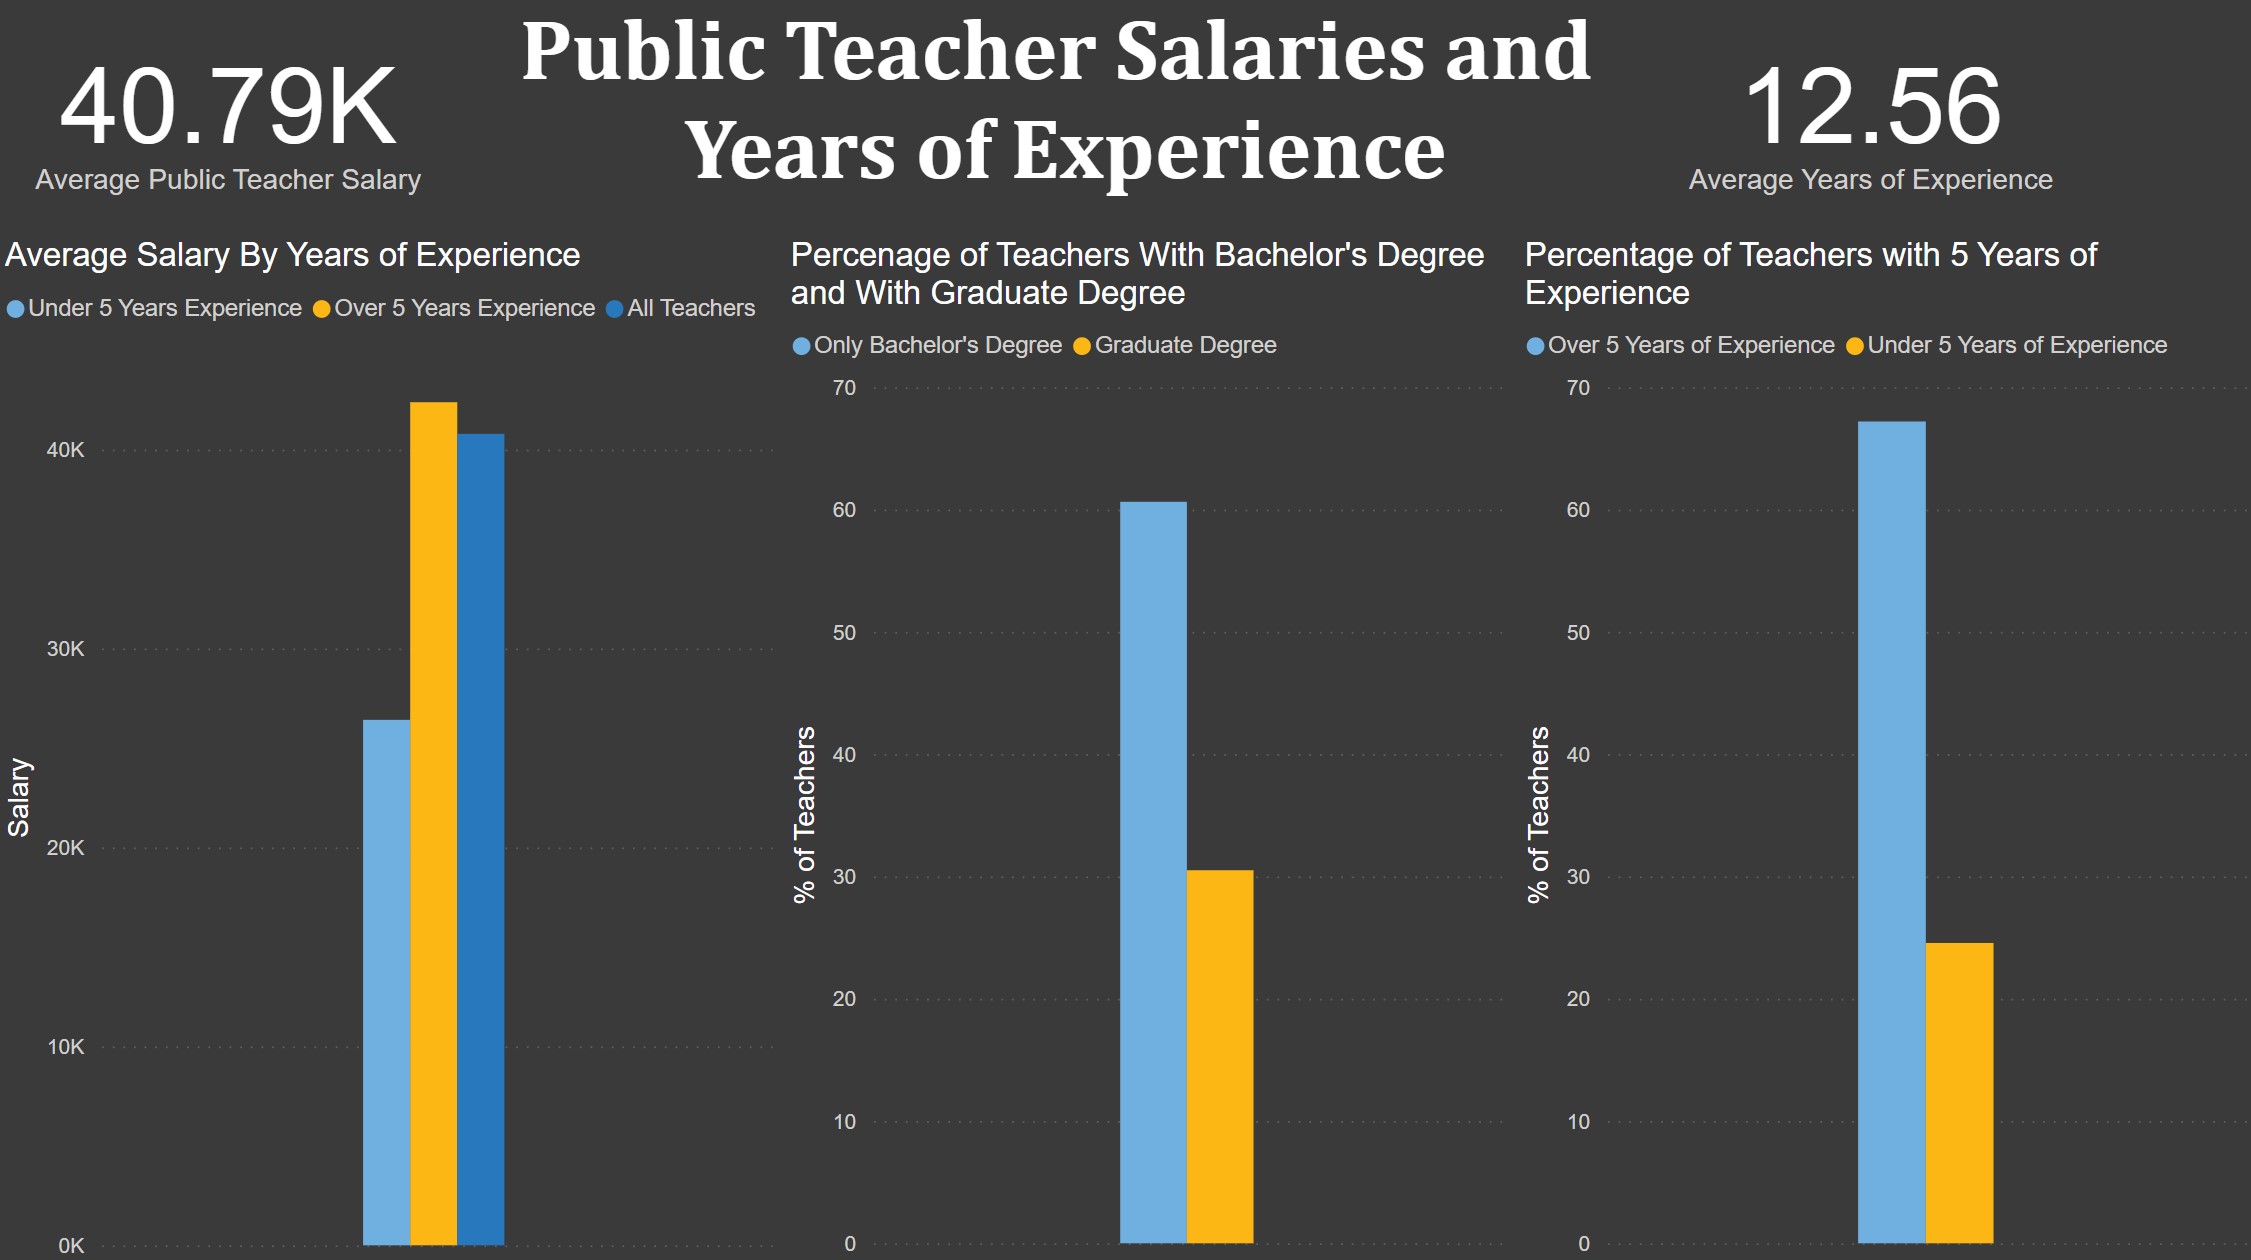
Public School Teacher Salaries
Shows public school teacher salary figures by years of experience. Also shows amount of education and years of experience for teachers.
Blog Posts


How Does A Random Forest Algorithm Work?
Random Forest algorithms can be used for classication or regression machine learning models.
Read MoreEducation
 Expected Graduation: 2025
Seattle University
Master of Science in Computer Science Specializing in Data Science
Graduated 2022
Seattle University
Graduate Certificate In Computer Science
 Graduated 2020
University of Washington
Bachelor of Science in Applied Physics
Skills and Relevant Courses
Relevant Courses
Database Systems, Data Structures, Algorithms, Computer Systems Principles, Scientific Computing, Fundamentals of Software Engineering, Artificial Intelligence, Machine Learning, Object-Oriented Concepts, Statistics, Calculus 1-3, Advanced Multivariable Calculus, Linear Algebra, Mathematical Physics, Engineering Graphics and Computing
Skills
Python, Java, C#, Git
Excel (VBA, VLookup, Pivot Tables, Conditional Formatting), Pandas, Numpy, Scikit-Learn, Jupyter Notebooks, Matplotlib
SQL, MySQL
ERP Systems, Smartsheets, Matlab, Sharepoint, PowerBI
Work
 April 2023-Present
Pricing Analyst - Keller Supply
 October 2020- April 2023
Packaging Department Lead - Elysian Brewing
September 2019- July 2020
Data Analyst - University of Washington
More About Me

I enjoy using tools such as Python, SQL, Power BI, and Excel to work with data to discover insights and patterns that can be used to tell a story, make predictions, or make business decisions. I am interested in roles where I can continue to learn new skills and continue working with data.
Originally, I got a degree in physics from University of Washington and was interested in civil and aerospace engineering, but during my senior year, while working as a data analyst for the Applied Physics Lab at UW, I discovered that coding and working with data was what I wanted to focus on in my career.
After graduating, I decided to go back to school to get a graduate certificate in computer science fundamentals from Seattle University. There, I learned how to write code in Java and C++. I also learned about data structures, algorithms, and how to use database systems with SQL.
Now I am working on my masters in computer science specializing in data science.
I am a big fan of hockey and football and my hobbies include reading, camping, hiking, and cooking.